UNIX-way: temperature monitor in 5 minutes
«Unix is simple. It just takes a genius to understand its simplicity.»
Dennis Ritchie.
The UNIX philosophy is not just a set of rules. It is ideology that is used everyday 'cause it's really useful and simple. Sometimes it's hard to explain the concept but I'll try to do it with the real example — the problem I have to solve recently.
I needed to keep my eye on the temperature of processor and graphics card. The temperature applet that is bundled with KDE didn't show me anything. I've spent some time trying to breathe new life into it but hadn't succeeded. Well, it's not a problem, let's «cook» a new applet! Actually I know how to find out the current temperature of different devices so I only need to show this information on a desktop.
The one of the most important UNIX-way rules is the Rule of Composition: «Design programs to be connected to other programs». This is exactly the type of programs we need to use now. For example, the popular stdin plasmoid allows to show output of another program directly on a desktop. It makes our problem easier as we only need to write the script that shows us temperature of all devices! A few questions could arise here — will the script be complicated, how much time we need to write it? Not much as we already have programs for reading temperature sensors and just need to enhance their output.
We use sensors to view the temperature of processor cores.
# sensors
coretemp-isa-0000
Adapter: ISA adapter
Core 0:      +40°C  (high =  +100°C)

coretemp-isa-0001
Adapter: ISA adapter
Core 1:      +33°C  (high =  +100°C)

coretemp-isa-0002
Adapter: ISA adapter
Core 2:      +40°C  (high =  +100°C)

coretemp-isa-0003
Adapter: ISA adapter
Core 3:      +32°C  (high =  +100°C)
The temperature of graphics card is shown by utility from manufacturer.
# nvidia-settings -q [gpu:0]/GPUCoreTemp
  Attribute 'GPUCoreTemp' (luna:0[gpu:0]): 45.
    'GPUCoreTemp' is an integer attribute.
    'GPUCoreTemp' is a read-only attribute.
    'GPUCoreTemp' can use the following target types: X Screen, GPU.
Hard drives are covered by hddtemp server that let you see on the page http://localhost:7634/ the following information:
|/dev/sda|MAXTOR STM31000340AS|41|C||/dev/sdb|ST3750330AS|37|C||/dev/sdc|ST3200822A|43|C|
Here are the device id, model name, temperature and its units for each hard drive.
The output of all utilities is very unsuitable for our applet. So we need to convert it to easy-to-read form. For example, the text from sensors would be modified by these commands:
# sensors | grep 'Core' | awk '{ print $1 " " $2 " " $3; }' | sed -e 's/+//' -e 's/^/CPU /'
Let's explain this code. We take sensors output and pick only lines that contain «Core» (the grep utility). We obtain
Core 0:      +40°C  (high =  +100°C)
Core 1:      +33°C  (high =  +100°C)
Core 2:      +40°C  (high =  +100°C)
Core 3:      +32°C  (high =  +100°C)
Then we pick 1st, 2nd and 3rd columns (if we imagine that it is a text table) and print them sequently separating by space (the awk utility). And we obtain
Core 0: +40°C
Core 1: +33°C
Core 2: +40°C
Core 3: +32°C
The last step is to delete «+» and to add «CPU » to the line beginning (the sed utility). Finally we obtain
CPU Core 0: 40°C
CPU Core 1: 33°C
CPU Core 2: 40°C
CPU Core 3: 32°C
This is more convenient to read.
We just used the Rule of Composition again by connecting four programs to gain the required result. Each of small programs grep, awk, sed do its own work well. grep print lines matching a pattern, awk works with text tables, sed edits lines. If they are put together — they become a real force.
Algorithm translation to the language of utilities is the last thing to do. The more important thing is to imagine how to extract data in principle, i.e. what would you do with a text in an editor. For example, to get «45» from nvidia-settings output, you should take lines with «Attribute», then pick 4th column, delete a dot. This is simple, isn't it? Dealing with the temperature of hard drives is a little bit harder but not much. Here we need netcat utility that will get a page content by host and port (localhost, 7634). As soon as it's done we break the text into three lines by inserting a newline between «||», then pick 2nd, 4th and 5th columns, print them specially, and finally replace «/dev/» by «HDD ». That's all!
You could see the resulting script here:
#!/bin/bash
#
# sensors.sh v0.1
# Copyright 2009, Nikita Melnichenko [http://nikita.melnichenko.name]
# License: GPL-2 (http://opensource.org/licenses/gpl-license.php)
#
# Output all sensors together.

# CPU temperature
sensors | grep 'Core' | awk '{ print $1 " " $2 " " $3; }' | sed -e 's/+//' -e 's/^/CPU /'

echo

# GPU temperatures
gpu_temp=`nvidia-settings -q [gpu:0]/GPUCoreTemp | grep Attribute | awk '{ print $4 }' | sed -e 's/\.$//'`
echo "GPU: $gpu_temp°C"

echo

# HDD temperatures
netcat localhost 7634 | sed -e "s/||/|\n|/g" | awk -F'|' '{ print $2 ": " $4 "°" $5 }' | sed -e "s,/dev/,HDD ,"
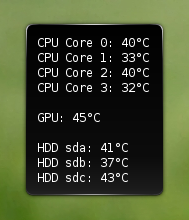
It reports the following:
CPU Core 0: 40°C
CPU Core 1: 33°C
CPU Core 2: 40°C
CPU Core 3: 32°C

GPU: 45°C

HDD sda: 41°C
HDD sdb: 37°C
HDD sdc: 43°C
At last we give our script to stdin applet, set update interval — and all is done — you can see temperature right on a desktop in realtime.

So the great merit of this approach is in capability to create a personal solution from universal components like from bricks. Somebody could think that it's pretty hard to write such a code. Of course, a five minute integration requires some experience. But the time spent for studying will be repaid many times. Just try it — and you'll make it.
Nikita Melnichenko.
Comments are closed